
-
The above Banner is a Sponsored Banner. Upgrade to Premium Membership to remove this Banner & All Google Ads. For full list of Premium Member benefits Click HERE.


GoldCore
Content Type
Forums
Premium Membership
Dealer Directory
Wiki
Videos
Prize Draws
Posts posted by GoldCore
-
-
This week on GoldCore TV, Dave Russell welcomes Tim Price of Price Value Partners. Tim sees the current inflationary pressures as simply the beginning of a bigger move that could end in a new monetary system.
Click Below to Watch the Video
Make sure you don’t miss a single episode… Subscribe to our YouTube channel
-
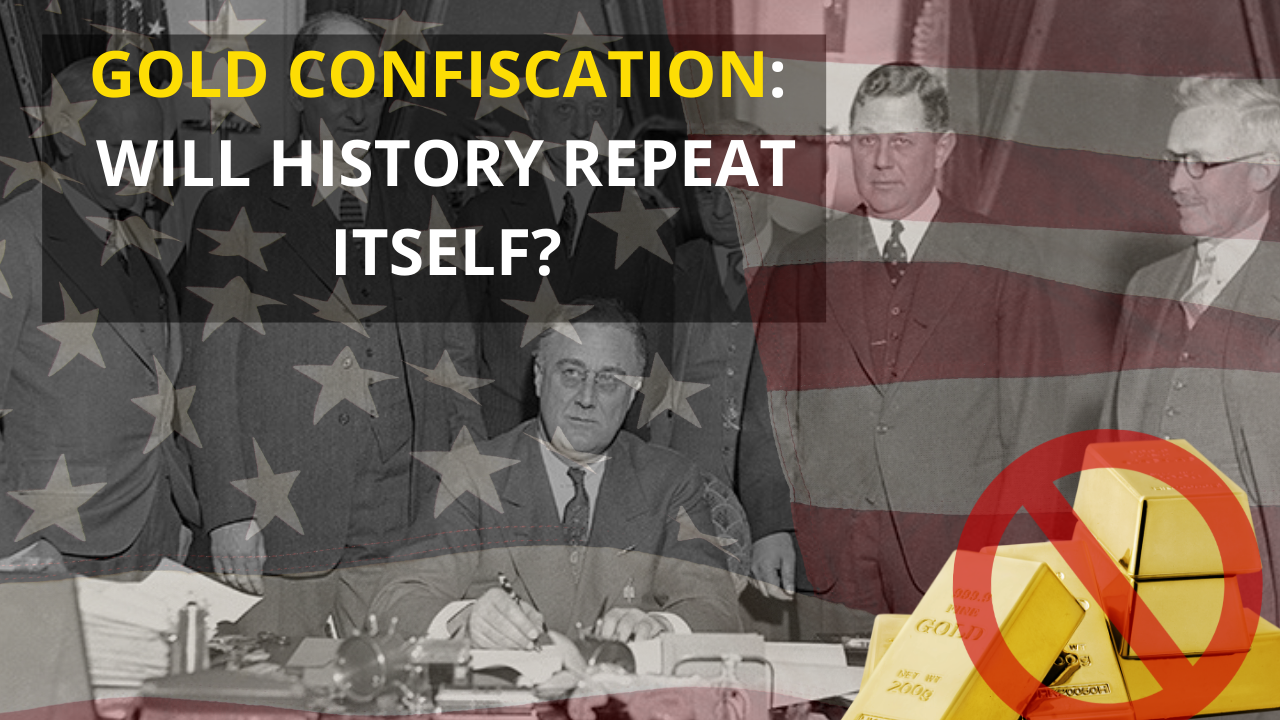
The facts of gold confiscation: The saga continues…
This is the second in a series of posts looking at the confiscation experience of the 1930s.
In our post Gold Confiscation: Will History Repeat Itself?
On March 31 we looked at the gold confiscation experience in America during the 1930s.
To recap we mentioned that then gold was official money according to the government. Also, the government needed gold inside the banking system to relaunch banks following the years of the Great Depression.
Since gold is not government sanctioned money today governments do not have the same need to call in physical metals.
Importantly last week we also mentioned that no gold was stolen. Banks and governments paid for every ounce of gold.
This week we expand on further threads of the confiscation story.Firstly -Why were some gold coins not called in while most were?
Europe Energy Dependence Crisis
Watch Steve St. Angelo Only on GoldCore TVAnd second, if a government did want to call in gold during the decade of the 2020s, could it even be accomplished? If so, how?
Numismatic Gold Coins Exemption
Turning to the first question of why some gold coins were exempt from the Executive Order to turn in gold to banks; Numismatic gold coins were exempt because they were considered objects of art or history. However, not functioning as money during the 1930s.
As with wedding rings numismatic gold coins were not considered vital gold for relaunching America’s banking sector after the depression of the 1930s.
The distinction between numismatic gold coins that were exempted from President Roosevelt’s Executive Order for gold versus general circulation gold coins can be slightly complex.
An example of a numismatic coin that would be exempt is the oldest known gold coin in existence which was found in 2014 by a scuba diver off Bulgaria’s Black Sea coast. Read more on the accidental discovery of this coin here.
Since this coin is both extremely rare and artfully beautiful it would have been considered numismatic and exempt from the 1933 Executive Order.
Being 2,700 years old and being literally one of a kind makes clear that such a coin would not have been turned into a bank.
Nor would any government agent be rightful in asking for this coin.
In fact, the President, or any government agent, who tried confiscating this coin would have intense dramatic unanswerable questions put to it by political opponents and the free press.
Politicians during the crisis will attack the large middle section of any solution while exempting the difficult problems of special cases found in small amounts.
Thus, Roosevelt’s Executive order called for the general circulation of coins and gold bars to be turned in. However, avoided battling over such items as historically significant or exceptionally emotional items like wedding rings and art.
No gold leaf picture frames were called in by Roosevelt the Executive order.
And yes, President Trump’s golden toilet in Manhattan would have been safe Roosevelt under the exemption.
So a single 2,700-year-old historic gold coin is numismatic. But what about a single gold coin purchased in 2020 from a dealer selling part of a 10,000-coin production run of collectible coins?Nope probably not numismatic.
Not if Roosevelt’s litmus test from the 1933 Executive Order was applied on an art basis alone.
Keep in mind that the Roosevelt litmus test of whether a coin was exempt did not care what premium was paid for the gold coin above its ounce value.
Gold Confiscation: Can it Happen Today?
Now to the second point – could governments even carry out a confiscation today?
The confiscation will not happen again. This is because bank bailouts by the government are now preplanned using living wills and contingent capital bonds.
But if we were today to make an ideological assumption that confiscation was possible for some reason, how could it be done?
As mentioned above governments like to avoid complaints from citizens and the media.
Therefore, it seems to us that the easiest place for government to get its hands on large amounts of gold are the futures market and the exchange traded fund market.
Any 2022 government trying to call in silver and gold would be smart to padlock the doors of LBMA and CME warehouses.There are close to 10,000 tonnes in these warehouses of gold owned not by small investors but by giant investment banks.
The hue and cry would be minimal since investment banks and government work together frequently already. Futures markets for gold did not exist in the 1930s.
If they had you can be sure Roosevelt would have started [and finished?] there instead of inviting discord from individual citizens.
Another important pot of gold exists today which did not exist in the 1930s.
Exchange Traded Funds [or ETFs] began in 2003 when the World Gold Council sponsored the very first one.
Today the dozen or so ETFs in existence collectively own more than 3,200 tonnes of gold.
ETFs hold more than 27,000 tonnes of silver.
The title to this gold rests not with individual investors but with corporate trusts controlled by lawyers and bankers.
Gold Price Today
Watch Gareth Soloway Only on GoldCore TVCertainly, Roosevelt would have claimed this ETF gold into the financial system during 1933 before bothering to call in coins and bars from individuals.
Confiscation as a historical event is worthy of study.
But we have shown it is not a worthy reason to fear the government stealing physical gold and silver held by individuals in this century.
-
This week on GoldCore TV, Dave Russell welcomes back Energy Expert – Steve St. Angelo of SRSroccoReport, to discuss Europe’s deepening energy crisis and how oil and natural gas markets are now being weaponised by Russia.
He is convinced that we are continuing to slide off the “energy cliff” and strongly argues that the best way to protect yourself is to buy gold and silver bullion now!
Click Below to Watch the Video
Make sure you don’t miss a single episode… Subscribe to our YouTube channel
-

This is the first in a series of posts looking at the confiscation experience of the 1930s.
Today’s topic is vital for many people.
Confiscation is a big word that has come to mean; stealing your physical bars but done by the government so it is legal.
In the world of physical metals confiscation has become a cautionary word used by companies selling a solution to the perceived threat that governments will steal physical metals once again.
On the surface, this idea seems plausible since the story often gets slanted to say that the U.S., thought of as the economically freest country of the 1930s stole gold from its citizens.
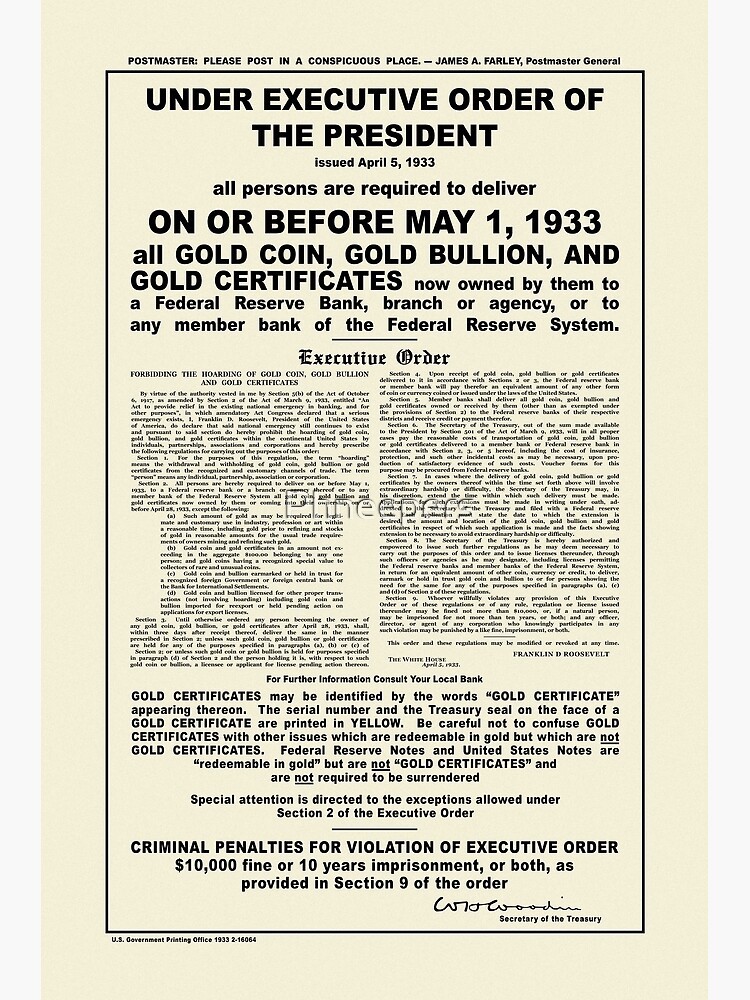
The U.S. government carried this out through Executive Order 6102 signed by the President – all persons were required to turn in their gold in exchange for dollars.
Executive Order 6102
The Executive Order
So, what really happened in 1933 and could it happen again?
Answers to those two questions will play out in posts over the coming weeks since the subject is so complex.
Yet in short, we can say what happened is that four years after the single worst banking crisis ever experienced by the U.S., the government was still trying to reliquefy the banking system.
But counterparty risk was still a big perception problem amongst bank depositors making progress slow.
As you know banking is about collective confidence because without that confidence in the system no one will make and leave deposits in a bank.
The first important point is that the U.S. government didn’t ‘steal’ anyone’s gold.
Download Your Free Guide
Click Here to Download Your Copy Now
The government and banks did pay cash right away for all the gold turned in by depositors.
Yes, it is true that later the price of gold was reset at a higher price, but no ounces were stolen.
The second important point is that this Executive Order was only in the U.S. It did not apply to non-US citizens and other countries did not issue such orders.
The third was that although penalties existed for not abiding, reportedly only one person was charged for hoarding gold and that charge was then overturned when the Executive Order was deemed to be not valid.
Why is Money Today Not Backed by Gold?
One big difference between 1933 and today is that gold is not money for banks today.
And it’s obvious that any government trying to reliquefy their banking system would care not a whit about calling in gold since
A) Almost no one has any and
") It’s not helpful to banks (explained below).
It’s not helpful to banks (explained below).
Politics drove the Executive Order and supported the legislation.
Franklin Delano Roosevelt was the American President in 1933, who had been elected years earlier to end the Great Depression.
Success had come slowly since the legislation he wanted to be passed was taking a very long time.
In fact, the effort to restart the banking system can be found in the very name of legislation passed by politicians.
The March 1933 law was called “An ACT to provide relief in the existing said national emergency in banking, and for other purposes”.
What the Executive Order did was prohibit the hoarding of gold coins, gold bullion, and gold certificates.
Gold Price Today
Watch Gareth Soloway Only on GoldCore TVSilver was not mentioned because silver was not money in the US during 1933.
Hoarding was defined by the Act as pulling gold out of the banking system in an amount greater than US$100 unless the holder had an exemption.
The Executive Order stated that gold inside the system was redeemed for US$20.67 or converted into certificates of gold redeemable later into U.S. dollars but not ounces of gold.
The US$100 limit was roughly 5 ounces of gold.
At today’s prices, the same dollar amount is nearly US$10,000.
The nearly 5-ounce limits were applied per person which meant that a family of four could hold almost 20 ounces of gold.
Expressed this way readers can begin to understand that Roosevelt hoped for preventing the one percent of rich people in America from delaying the rebuild of banking confidence that was needed to gain confidence with the other ninety-nine percent of Americans.
The ‘us versus them’ aspect of the legislation was visible later when four Republicans on the US Supreme Court wrote dissenting opinions about legality.
Gold was not criminalized.
It is critical to understand gold as legal money in 1933 but is not today. People in 1933 were keeping gold money outside the banking system because no one wanted to ‘go first’ at trusting the banking system following 5 years of collapses.
Expressed in today’s language the law said…
don’t remove more than 5 ounces if you fear a bank panic is coming because the bank needs that gold to prevent the panic.
Preventing bank panics is always in the public interest from the perspective of governments.
Why the US Dollar is Doomed
Watch Lynette Zang Only on GoldCore TVAnd since gold today plays zero roles in banking panics governments have no reason to confiscate gold for this reason again.
An analogy today that puts the negativity around hoarding then in context is to think about hedge funds today trying to collapse a single stock by naked shorting that stock.
Pulling all the gold out of an otherwise healthy bank in 1933 was like a hedge fund’s ability to short stock today since both were non-confidence claims in the system that also erode other people’s confidence in that stock (or in 1933 the bank).
From the paragraphs above readers can already see that 1933 was a defensive move by the U.S. government designed to reliquefy banks and reinstall confidence in a banking system that had already been in crisis for half a decade.
The 1933 law was designed and passed to assist with the success of the government’s other actions to bail out the good actors inside the banking system at the expense of bad actors.
The Evolution of Banking Over Time
The banking system is very different today than in 1933.
In 1933 America had tens of thousands of individual banks almost all were tiny operators having a single branch. However, today there are less than a hundred global banks serving nearly the entire globe using technology instead of branches.
Today’s banks have deposit insurance which did not exist in America before FDR.
Those who fail to learn from history are doomed to repeat it.
So, what can we learn about history with respect to future confiscation? Well, that question points us toward asking … could it happen again?
The single-word answer is no. A full answer will be discussed in future posts. For now, let’s discuss just one small corner of that answer.
Bank bailouts look very different in today’s world. The 2007-12 Great Financial Crisis was an event of financial calamity not seen since the banking troubles of the early 1930s.
Massive government printing that went on then did not require gold to happen. Governments did not and will not confiscate gold to be held by the banking system.
Furthermore, following the great financial crisis of 2007-2012 politicians got the message – voters now refuse to pay for the next collapse of banks caused by greedy decisions made by those same bankers.
Legislation passed in the USA, UK, and EU requires banks all to keep a living will.
This will determine who must contribute what should the bank become insolvent.
Globally enforced regulation keeps bankers’ risk-taking with depositors’ money in check.
Governments will not use taxpayer gold or taxpayer money to bail out bad decisions. Bail-ins are the new bail-outs.
What are COCO bonds?
An entirely new class of securities has been invented to prepay for the next banking crisis named COCO bonds.
The full name is Contingent Convertible Bonds. Some jurisdictions call COCO bonds by the name Enhanced Capital Note or ECN.
A COCO bond automatically converts into the equity of the bank during a crisis.
COCO bonds pay higher yields as compensation for underwriting the risk of being converted into bank equity during a crisis.
Future posts on this topic will tackle other important aspects of this subject such as numismatic coins, exemptions to the 1933 law, and ETFs versus physical metals.
-
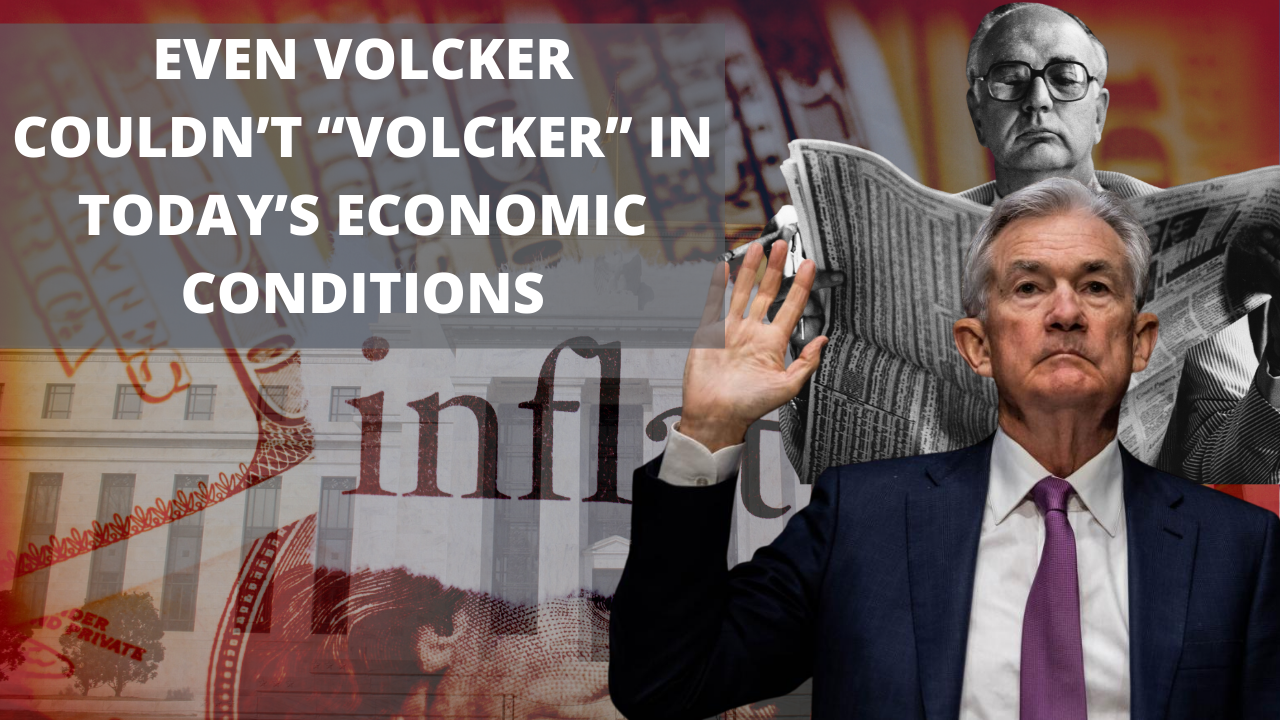
Even Volcker couldn’t “Volcker” in today’s economic conditions
We have discussed policy – especially monetary policy often recently.
This is because currency values are directly impacted by policy, and gold is a currency, therefore, is directly impacted by the policy.
Although it is arguably changing, the U.S. dollar is still the ‘reserve currency’, a large percentage of trade, and most commodities are still priced in U.S. dollars.
This keeps the Federal Reserve’s (Fed) actions important to the gold market.
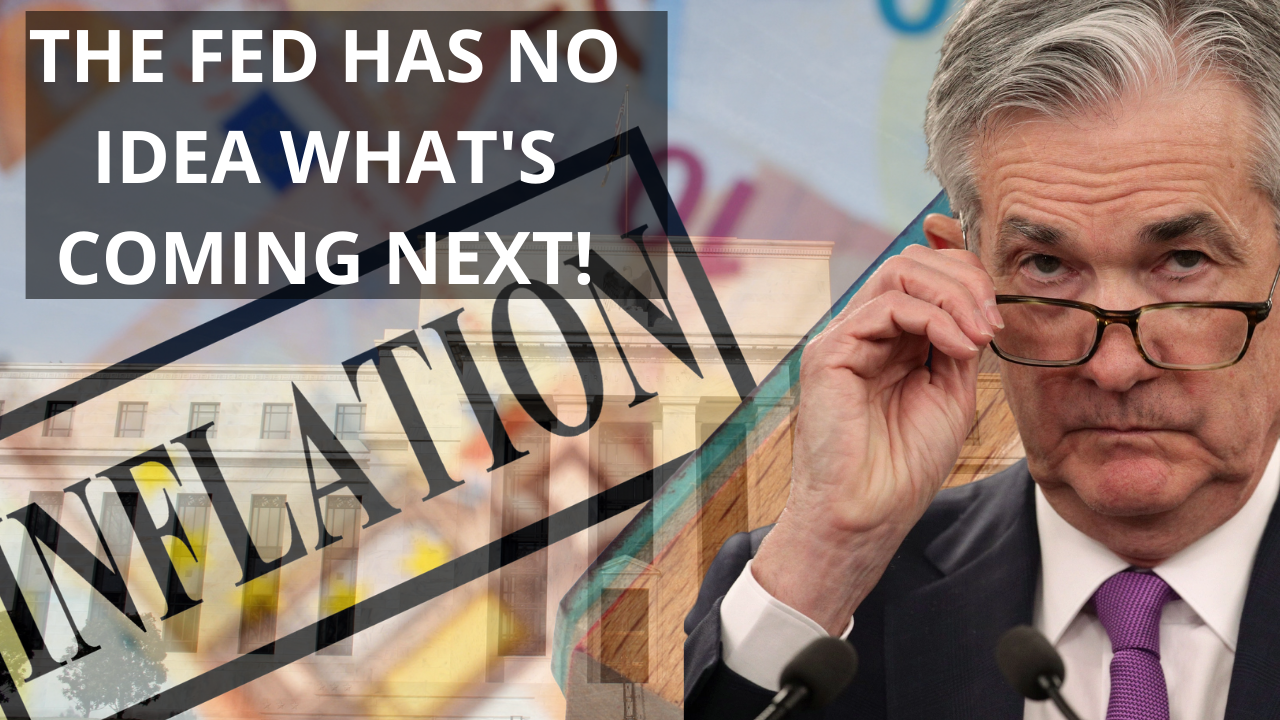
We discussed the Fed’s March 15-16 meeting and Chair Powell’s press conference in our post The Fed Has No Idea What’s Coming Next! In that post, we discussed the updated Fed outlook for rates is much higher than in December.
Gold Price Today
Watch Gareth Soloway Only on GoldCore TVThis week Chair Powell spoke in Washington DC at the National Association for Business Economic meeting. He reaffirmed his previous statement that the Fed could raise rates as fast as Volcker did back in the late 1970s-early 1980s.
And went on to reaffirm that the Fed could raise rates past the ‘neutral rate’.
The neutral rate is defined by the Federal Reserve of Dallas as: The neutral rate is the theoretical federal funds rate at which the stance of Federal Reserve monetary policy is neither accommodative nor restrictive.
It is the short-term real interest rate consistent with the economy maintaining full employment with associated price stability.
History tells us that when the Fed raises rates to the neutral rate that it soon must rapidly cut rates because an economic recession is on the horizon or has already taken hold.
The Volcker Shock
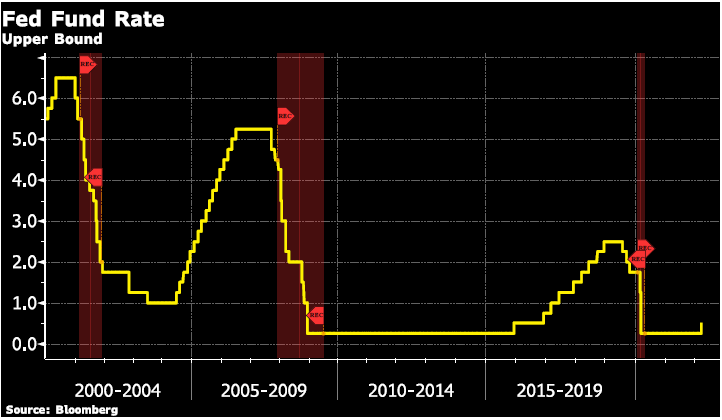
This most recent Powell speech deliberately invokes the Fed’s greatest triumph of decades past and the comparison implies the current Fed could once again ‘Volcker’ interest rates. On this point, we start with a short recap on the ‘Volcker shock’.
Paul Volcker was the Fed Chair from 1979 to 1987 and is known for rapidly raising interest rates starting in the late 1970s to combat high inflation.
Moreover, by 1980 the fed funds rate was at 20%, the highest in history. Also, Volcker kept the fed funds rate above 15% until mid-1981.
Also, this rapid and prolonged rise in interest rates became known as the “Volcker shock”.
The rapid increase in interest rates did indeed lower inflation but also caused back-to-back recessions in the early 1980s.
Also, the Volcker shock worked in the early 1980s. This was to end high inflation under a very different economic environment than exists today.
First, the 1970s high inflation largely did the decision by then President Nixon to close the gold window in early 1970, after which the U.S. dollar plummeted.
To try and stop the rising inflation Nixon implemented wage controls. This made the situation worse and turned the problem into stagflation. High inflation with low economic growth due to restricted business activity.
The Fed Chair in the early 1970s Alfred Hayes was faced with trying to fight off inflation while maintaining growth – and raised and lowered the fed fund rates in cycles.
Moreover, this only added to the inflation problems as consumers tried to purchase ahead of interest rate increases.
The increased demand pushed prices higher until Volcker became Fed Chair. It was clear that he would continue to increase interest rates until this demand was stifled.
What Happens Now?
In today’s environment, the high inflation is largely due to supply shortages. This was exasperated by the Russia/Ukraine war and the disruption of commodities that are produced in Russia.
Also, this brings us to our second point. Even Paul Volcker couldn’t today raise interest rates as high past the rate of inflation as he did in the early 1980s.
The main reason is high government debt.
Volcker himself addressed concerns about rising government debt in a 2016 op-ed in the New York Times. It was co-authored with Peter Peterson titled “Ignoring the Debt Problem”.
Here is an excerpt:
Download Your Free Guide
Our current debt may be manageable at a time of unprecedentedly low interest rates.
But if we let our debt grow, and interest rates normalize, the interest burden alone would choke our budget and squeeze out other essential spending.
There would be no room for the infrastructure programs and the defense rebuilding that today have wide support.”
Volcker and Peterson go on to say:
“It’s not just federal spending that would be squeezed.
The projected rise in federal deficits would compete for funds in our capital markets and far outrun the private sector’s capacity to save, to finance industry and home purchases, and to invest abroad.
Instead, we’d be dependent on foreign investors’ acquiring most of our debt — making the government dependent on the “kindness of strangers” who may not be so kind as the I.O.U.s mount up.”
And who amongst the international community is going to buy this U.S. debt. Japan is the largest international holder, so maybe them.
What about other large buyers, the second largest in China which is highly doubtful since China is trying to de-dollarize.
As we have stated before the Fed is indeed between a rock and a hard place. However, a hardline increase in interest rates past the rate of inflation is unlikely in the current deck of cards, which is positive for gold and silver.
-
Dave Russell of GoldCore TV welcomes back Gareth Soloway of InTheMoneyStocks.com where we ask if the bull market for stocks is back and if $2,500 on gold is still on the cards for 2022?
What role does the inversion of the yield curve play in signaling a US recession?
Click Below to Watch the Video
Make sure you don’t miss a single episode… Subscribe to our YouTube channel
Why the US Dollar is Doomed
Watch Lynette Zang Only on GoldCore TV -
We will let you know what we are doing once we know what we are doing
was the message from the Federal Reserve statement and Chair Powell’s press conference that followed.
The Fed, as widely expected did raise their short-term rate, known as the fed funds rate, by .25% to a range of 0.25% to 0.50%.
This was the first increase since 2018.
Along with the statement FOMC (Federal Open Market Committee) participants also released their Summary of Economic Projections.
This gave an indication of where the committee members view economic indicators going forward.
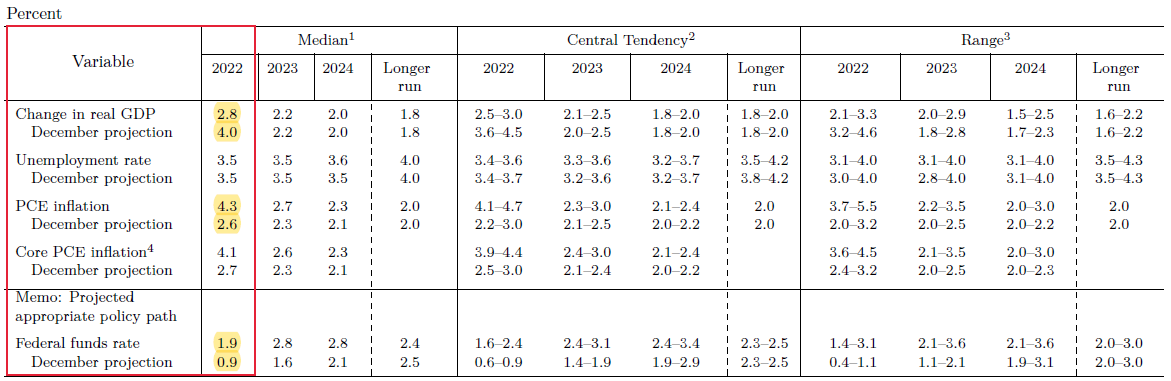
FOMC Summary of Economic Projections
There are a few of the FOMC projections that we want to point out in the table below.
-
The first is that the FOMC participants are now projecting U.S. GDP growth this year of 2.8% vs a projection of 4.0% at their December meeting.
The next is the higher inflation projection – which isn’t a surprise that they increased it. However, we want to point it out because it is key to the discussion below, and the last is the increase in the fed funds rate projection.
This projection represents where the committee members project the fed funds rate to be at the end of 2022, which currently stands at 1.9% vs 0.9% at the recent December meeting.
Why the US Dollar is Doomed
Watch Lynette Zang Only on GoldCore TV
The first of these is the revised down U.S. GDP projection, as Chair Powell pointed out 2.8% is still a solid GDP projection.
To put it in perspective – real GDP growth averaged 2.25% from 2010. After the Great Financial Crisis, through 2019, before the start of widespread Covid-lockdowns wreaked havoc on economies.
Download Your Free Guide
-
The second is the fed fund rate projection. The FOMC is now projecting a .25% increase across the remaining 7 meetings reaching 1.9% by yearend.
Comparing this to the last cycle when the Fed raised rates starting in December 2015 it took two and a half years to get to the 1.9% range.
This pace is in line with the previous cycle in 2004.
-
The third and in our view one of the most important is the increase in inflation compared to the increase in the interest rates.
The FOMC is projecting inflation to average 4.3% higher this year compared to last year. Also, a fed funds rate of 1.9% at year-end.
Using these projections means that the real fed funds rate is a negative 2.4%.
Said another way the fed is not raising rates as fast as inflation is rising – or the ‘fed is behind the inflation curve’.
This strategy is good for borrowers – and bad for savers.
And remember that the U.S. government is a big borrower and in our post, March 4, 2021 “Central Banks Will Still Do “Whatever It Takes”! we discussed the Fed and highly indebted governments want and need inflation to ‘grow’ their way out of debt.
The Fed Is Stuck Between a Rock and a Hard Place
And with PCE inflation coming in at 6.6% in January. This was before the rise in commodity prices and additional supply constraints and issues due to the war were even a factor.
This was compounded by the rise in wages that has still not peaked we think that the 4.3% projection for this year is low.
The Fed is still between a rock and a hard place. It is only getting tighter for them to maneuver.
The geopolitical uncertainty not only with the invasion of Ukraine by Russia but now with China. Also, the increased push for de-dollarization after sanctions are all adding to an already uncertain outlook.
Then on top of that, there is the LME not only halting trading on nickel after the price surged on March 7, but also canceling contracts.
And the reopening of trading on March 16 did not go smoothly – although this is not a direct impact on the Fed. Lost trust in market infrastructures is certainly a factor for them to consider.
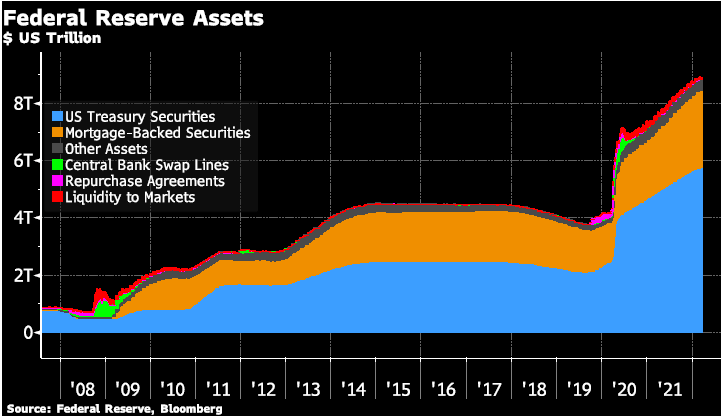
Remember when markets lost trust in counterparties in 2008-09 – the Fed (and other central banks) stepped in with massive asset purchases to stabilize markets.
The Truth About The National Debt
Watch David M Walker Only on GoldCore TVThose asset purchases continued until 2014 – and then started again on an even grander scale in 2020 and have now expanded the Fed’s balance sheet to around US$9 trillion. In respect to the balance sheet, the March 16 Fed statement said,
“the Committee expects to begin reducing its holdings of Treasury securities and agency debt and agency mortgage-backed securities at a coming meeting”
and Chair Powell only elaborated on this plan in the press conference saying,
“it will look familiar but at a faster pace”.
What the pace of reduction remains to be seen – but knowing that the Fed is hesitant to disrupt markets when reducing its balance sheet, it can’t ‘sell’ assets very quickly.
By buying these assets the Fed has already disrupted the market and changed/removed pricing and risk mechanisms.
Markets don’t believe the Fed’s projections
When the statement and economic projections were first released markets reacted to the tighter policy as expected – i.e. U.S. equities declined, the gold price declined, and the U.S. 10-year yield rose.
However, by the time that Chair Powell’s press conference was over, all this reversed as markets digested the information that the Fed has no idea what comes next and is not seriously going to raise rates past the rate of inflation – keeping real interest rates negative and policy somewhat accommodative for now.
Which is positive for gold and silver investors.
-
The first is that the FOMC participants are now projecting U.S. GDP growth this year of 2.8% vs a projection of 4.0% at their December meeting.
-
This week on GoldCore TV, Dave Russell welcomes Lynette Zang, Chief Market Analyst of ITM Trading, to discuss how central banks have weaponized financial assets to exert pressure on Russia.
Will these actions have unintended consequences not only for financial markets but also for central bank currency reserves, jeopardizing the USDollar’s status as the world’s reserve currency and undermining the global fiat currency system?
And why Lynette Zang believes that only gold and silver will keep you safe from the impending financial disaster.
Click Below to Watch the Video
Make sure you don’t miss a single episode… Subscribe to our YouTube channel
-
We wrote about this point recently. But we are saying it again because the message is so important. IF YOU DON’T HOLD IT THEN YOU DON’T OWN IT (IYDHITYDOI).
IYDHITYDOI is becoming a clear fact to people who had never considered it as a problem.
Bankers and finance people use the term ‘counterparty risk’ which is a complicated way of saying that its possible someone will not deliver on their contract obligation (which in other words is a promise to deliver a good, or service, or money at a specific date and time).
It matters not whether they wish to deliver but cannot because of circumstances such as a change in law or other reasons.
Or if they simply choose not to deliver on the contract. In either case, your plans go unfulfilled.
If it happens that your plan was wealth and security by ownership of important assets that are now not delivered, then the consequences are formidable.
The only responsible approach other than physically holding something yourself is attaching your name to the asset in a way that cannot be reversed.The Truth About The National Debt
Watch David M Walker Only on GoldCore TVAt Goldcore we call this method ‘fully allocated’ and or ‘fully segregated’ held under bailment.
Your physical metals are in your name whilst no one, including us or even a Judge, could show them as an asset belonging to anyone but yourself.
In essence, this structure means that you are still holding your metals even when you are not physically standing in the vault.
Our team is always happy to explain the details so call anytime.
Meanwhile, this essay will continue exploring IYDHITYDOI experienced by people who are not [yet] Goldcore clients.
Physical Metals- An Asset with Zero Counterparty Risk?
Physical metals like gold and silver have zero counterparty risk.
That is the great advantage during wartime for physical holders that no one else is counterparty or has to deliver on their obligation to maintain your wealth.
Furthermore, no one else has to even know about your physical metal holdings, and no one tempts to treat your wealth as their own wealth.
2022 has shown that IYDHITYDOI is very much true for companies and countries.
Below we site three recent examples of ‘counterparty’ risk or wealth being confiscated or held by the counterparty.
In each case, the counterparty risk was unexpected because a fully allocated or segregated bailment was not used.
The list does not limit to physical precious metals. There are many more examples of IYDHITYDOI and as the year is only one-third complete many more instances are sure to show up in 2022.
2022’s next lesson regards a different element, uranium. Uranium is the key element in nuclear weapons.Uranium and Ukraine: The Nuclear Connection
During 1992 Ukraine inherited thousands of nuclear weapons as USSR collapsed.
Those weapons had been stationed inside Ukraine for decades to ensure NATO never invaded Ukraine and or invaded the USSR.
The deterrent was effective. NATO never came close to invading Ukraine or USSR because the prospect of nuclear war means the death of NATO too.
Thus, the holding of nuclear weapons meant the ownership of security from invasion.
Yet by 1996 Ukraine agreed to give up all its nuclear weapons. Nuclear weapons left Ukraine in exchange for written pledges from USA and Russia to protect Ukraine’s borders by never invading.
As 2014 and 2022 show, now Ukraine has neither nuclear weapons nor security from invasion.
Once again it becomes clear that in a complex world; if you don’t hold it then you don’t own it.
One wonders if in this example, Ukraine kept its nuclear weapons vaulted inside the country under a United Nations bailment stating Ukraine owned them and planned defensive use only, Russia would have dared to invade in 2022, or even 2014.
Worst Crisis: LME Suspends Nickel Trading
Nickel futures have doubled in price this week.
This should be great news for nickel investors who were long the futures contract because they wanted to take physical delivery of the metal.
But again, it turns out IYDHITYDOI. Apparently, some Chinese businessman is so short of nickel futures that he cannot cover his positions via deliveries of physical nickel into exchange warehouses.
In what seems like an unfair unilateral move the London Metals Exchange has suspended the ability to settle nickel futures in physical metal.
Therefore futures investors who wanted physical metal delivered to them cannot get it. Instead during this time of crisis when physical metal matters most, the LME says all trades will settle in fiat cash only, not nickel metal.
This episode exposes once again a key problem for people using futures contracts to buy metals; when you really need it, the counterparty risk is too great since if you don’t hold it then you don’t own it.
Banks legally confiscating your money
Our final IYDHITYDOI this week is the Canadian protest truckers.
Last month the federal government in Canada seized wealth that belonged to people protesting against pandemic lockdowns.
The government used its control over regulated banks to confiscate money donated for helping protestors.
To accomplish this government sanctioned banks to freeze personal bank accounts.
People who thought they owned their money learned that because money held in a bank account is treated under the law as unsecured credit.Thus subject to government interference; if you don’t hold it then you don’t own it. Again bailment would have helped the situation.
To conclude this week’s essay, we reiterate Goldcore’s business model to serve physical metals investors is the best, and the only, way we know how to ensure you own what you own.
Our offerings are designed to tackle the IYDHITYDOI problem regardless of whether you hold physical in your own vault or the bailment storage options we provide.
-
Dave Lukas of Misfit Entrepreneur invites Stephen Flood, CEO of GoldCore, to the show. Dave and Stephen talk about what people should know before investing in gold and silver, the present state of inflation, central banking, and the monetary system.
Further, he explains why gold is still your safe-haven asset and how it provides you with personal sovereignty. They also talk about cryptocurrencies and their future.
Stephen also discusses some of the lessons he’s learned along the route to being a successful entrepreneur.Click Below to Listen to the Podcast
Download Your Essential Checklist
The Truth About The National Debt
Watch David M Walker Only on GoldCore TV -
As part of the sanctions against Russia, seven Russian banks have been cut off from SWIFT.
We start by discussing what SWIFT is, and then the implications of completely cutting Russia out of SWIFT.
What is SWIFT and Why Russia is Being Excluded
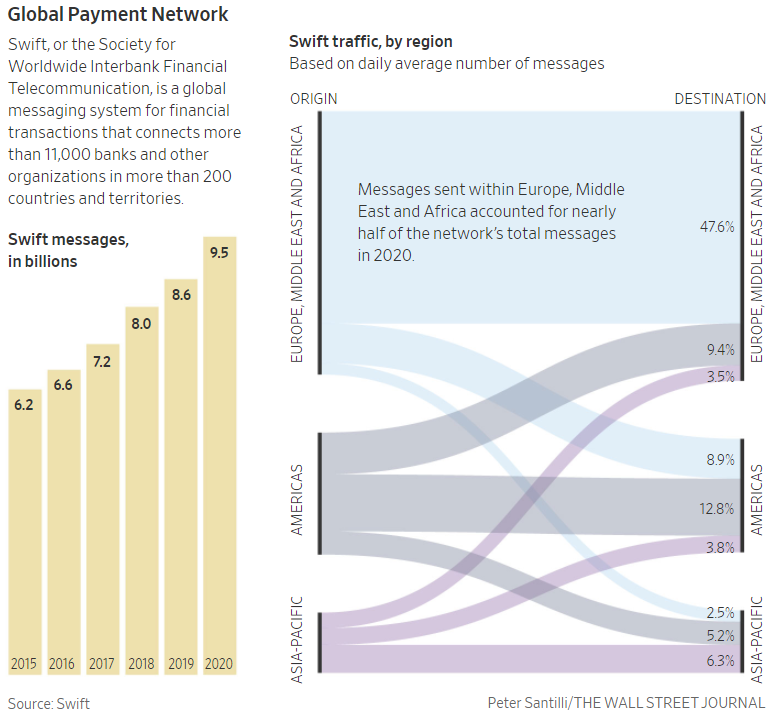
SWIFT – The Society for Worldwide Interbank Financial Telecommunication is a messaging system that links more than 11,000 banks in 200 countries.
The system doesn’t move actual money between the banks but transmits messages between banks with instructions to settle transactions.
Additionally, this system is crucial to the international trade system – without it, countries wouldn’t be able to settle trade transactions between countries.
The bar charts in the graphic from the Wall Street Journal below illustrate the growth in SWIFT messages from 6.2 billion in 2016 to 9.5 billion in 2020.
Also, the right side of the graphic shows “SWIFT traffic, by region – notably 47.6%, nearly half, of the messages sent was within Europe, the Middle East, and Africa.
The Truth About The National Debt
Watch David M Walker Only on GoldCore TV
Global Payment Network Chart
Two key factors underlie the dilemma of cutting Russia’s access to SWIFT altogether:
-
The first is how to cut the Russian banks completely off SWIFT but keep the channels open to purchase Russia’s oil and natural gas, especially in Europe, where prices have already surged over the past year.
In our January 20 post “European Energy Crisis: 4 Things You Must Know!” the 4th point was that Russia supplies ~40% of Europe’s natural gas. If this supply is no longer available prices will surge even higher!
-
The second is if Russia is completely cut off of SWIFT it would be incredibly difficult for foreign banks to collect money owed to them from Russia’s banks.
According to the Bank of International Settlements Russia-based entities and banks owe foreign banks approximately $120 billion in assets, of this amount about $15 billion is owed to U.S. banks with another $25 billion of this owed to Italian and French banks.
Why SWIFT Ban is Significant for Russia?
SWIFT is the largest interbank messaging system – it benefits from the network effect, if most other banks are on the system, then banks are encouraged to join.
A large number of members reinforces and expands the network.
There are other messaging systems such as Telex, and Russia and China both have their own payment systems.
However, messaging systems such as Telex are less efficient and more expensive.
Russia’s own system only has 23 foreign banks connected, and China’s Cross-Border Interbank Payment System (CIPS), with around 176 participants in 47 countries is still very small in comparison to SWIFT.
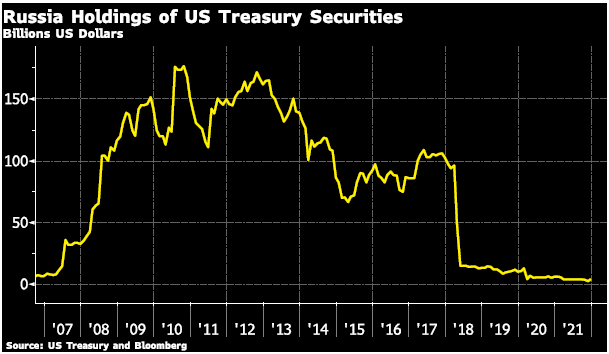
Additionally, the interconnectedness of the banking system and reliance on U.S. dollars has been an issue that Russia (and China) have been working to change.
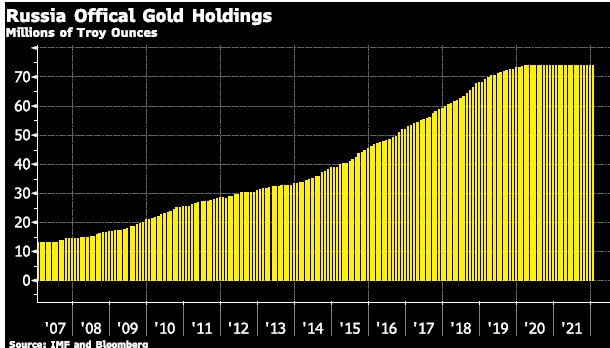
Moreover, Russia has strategically ‘de-dollarized’ its official reserves for many years.
And instead of a currency issued by another central bank, Russia has increased its official gold holdings.
Russia Holdings of US Treasury Securities
Russia Official Gold Holdings
Recent events have underlined the importance of your legal control of your precious metals.
That is why we offer fully allocated and fully segregated storage for your gold and silver, which we hold in bailment and not on our balance sheet.
This represents the safest form of custody for your assets
-
The first is how to cut the Russian banks completely off SWIFT but keep the channels open to purchase Russia’s oil and natural gas, especially in Europe, where prices have already surged over the past year.
-
On today’s episode of GoldCore TV, David Russell welcomes David M Walker, the former Comptroller General of the United States, to discuss the National Debt Crisis in the United States and how only a deepening of the problem will force policymakers to take unpopular steps necessary to avoid disaster.
How much worse will the situation get before they act?
What does this mean for financial markets?
Watch the full interview to find out…Click Below to Watch the Video
Make sure you don’t miss a single episode… Subscribe to our YouTube channel
-
This week, Tom Bodrovics of Palisades Gold Radio was joined by Stephen Flood, CEO of GoldCore to discuss the concerns about Fed mandates and how higher interest rates may lower inflation but may kill the economy.
Watch the full episode to learn why Stephen believes gold is not your productive asset and where he discusses his views on cryptocurrencies and the significance of silver in war times.
When individuals realize the future is uncertain and begin to tighten their belts, Stephen believes gold prices will begin to shift dramatically.
Click Below to Watch the Video
Make sure you don’t miss a single episode… Subscribe to our YouTube channel
Is The Biggest Stock Market Crash Imminent?
Watch Michael Pento Only on GoldCore TV -
Gold has rallied strongly on the news of Russia’s invasion of Ukraine.
It has rallied above at US$1,970.
The invasion occurred as the US and Europe start sanctions against Russia.The U.S. and its European allies on Tuesday announced a broad range of sanctions against Russia for what President Biden called “the beginning of a Russian invasion of Ukraine” (WSJ.Com, 02/22).
The U.S. sanctions are against two major Russian banks and Europe is halting the Nord Stream 2 natural gas pipeline.
These sanctions are a small part of a larger package of sanctions threatened by the U.S. and European allies – but are designed to limit Russia’s access to global financial markets.
However, many believe that these sanctions are now obviously, not enough to dissuade Russia from a further incursion into Ukraine.Today, NATO allies and separately G7 leaders are meeting today to consider further actions.
Is The Biggest Stock Market Crash Imminent?
Watch Michael Pento Only On GoldCore TVTo elaborate on our discussion in the recent podcast “Gold is Needed as a Safe Haven Investment Now More than Ever!” gold has once again served its role as a safe-haven asset and portfolio diversified.
This means it is going up when most assets are declining.
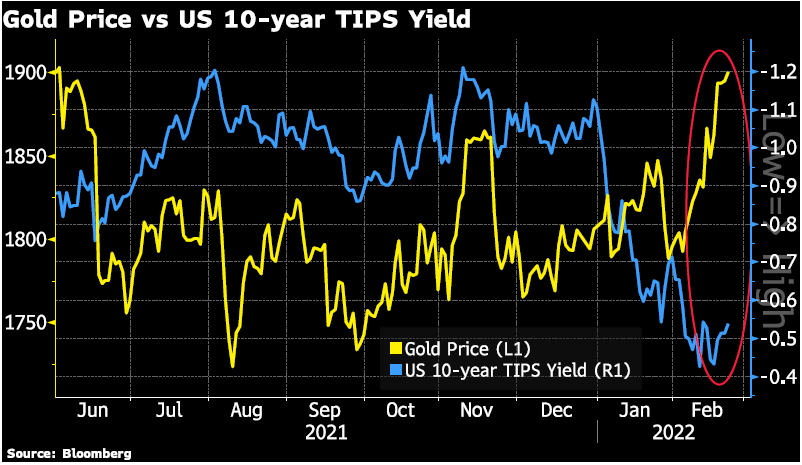
On this point – gold has broken away from its fundamental ‘usual’ negative correlations with real interest rates.
The chart below shows the US 10-year TIPS (Treasury Inflation Protected Securities) as an example of this relationship.
Gold’s Correlation
The U.S. 10-year TIPS yield (blue line) axis is inverted to show the general inverse relationship of the gold price to TIPS yield – in general when TIPS yield rise, as they have done since the beginning of the year, going from around -1.1% to -0.5% the gold price would generally decline.
However, when the safe heaven effect ‘kicks in’ the gold price can also rise. In other words, the safe haven buying is a stronger bullish gold price force than the bearish signal of a rising TIPS yield.
Gold Price V/S US 10- Year Tips Yield
The Safe Haven Aspect of Gold
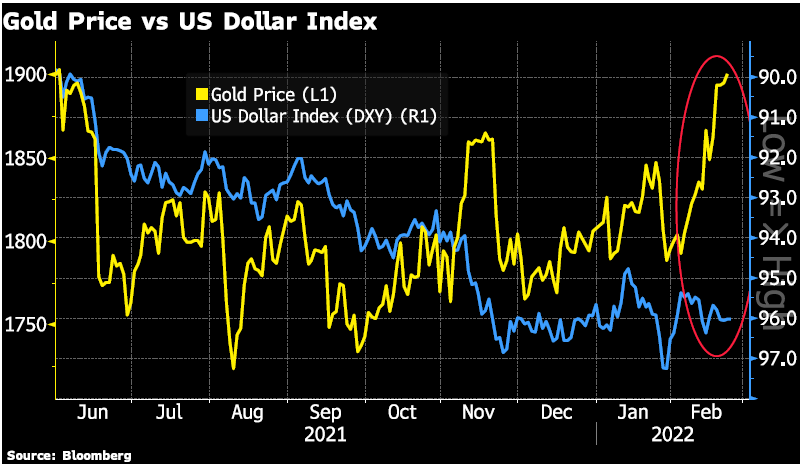
The same inverse relationship generally holds for the gold price and the U.S. dollar. When the U.S. dollar rises the gold price (in US dollars) generally declines – the rising U.S. dollar was a major bearish signal for gold in 2021.
However, again this negative relationship is broken in times of safe-haven buying – since the beginning of February, the gold price has risen US$100 while the U.S. dollar has been flattish.
These are two examples of how safe-haven buying outweighs fundamentals.
Gold Price V/S US Dollar Index
However, the really important aspect of gold as a safe-haven asset is that, as pointed out in the above-mentioned podcast, it retains or increases its value when most other assets are declining.
Gold is Needed as a Safe Haven Investment Now More than Ever!
This aspect of gold (and silver) is becoming even more important as world markets become more correlated.
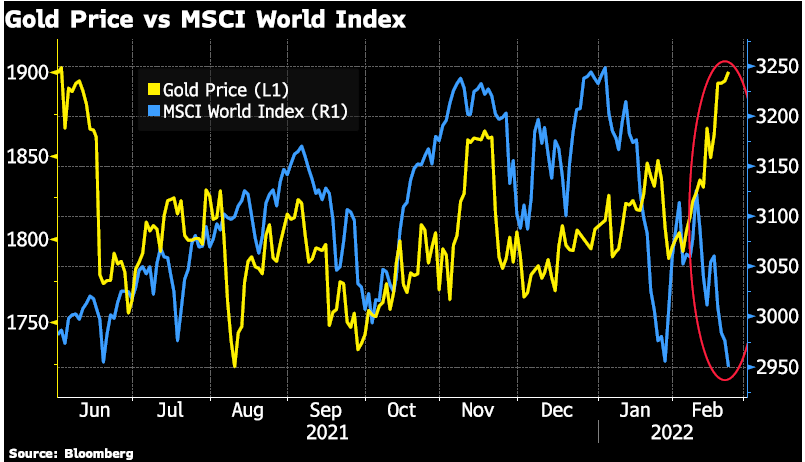
The first chart below shows the MSCI World Index which is down more than 20% from its peak set in November last year, which is somewhat indicative of most equity indices.
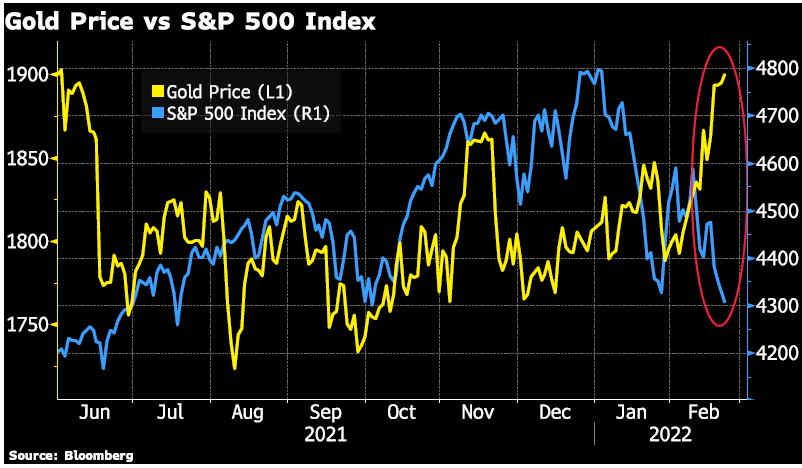
The second chart below shows the gold price and the S&P 500 index, which did manage to continue climbing until January 3 but has since declined just over 10%. And as noted above the gold price has risen over this period.
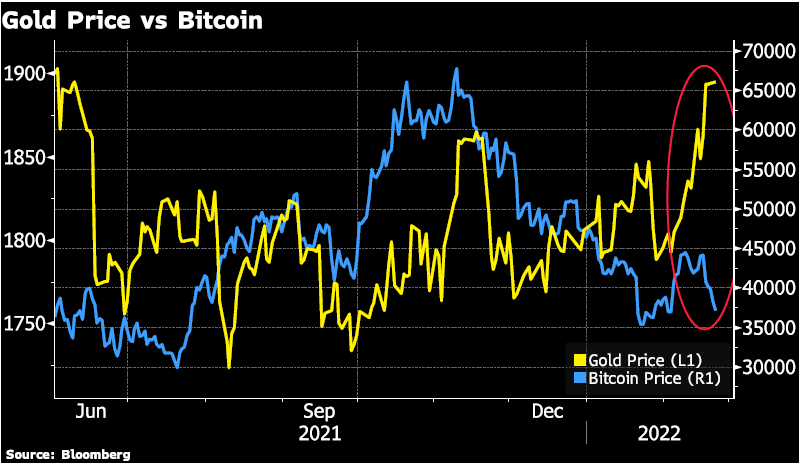
The third chart below shows the gold price and the bitcoin price – although bitcoin has been touted as a safe-haven asset as the chart shows it has failed to live up to that status during this geopolitical safe-haven buying episode.
If the Russia/Ukraine geopolitical crisis continues on its current trajectory we can expect higher gold (and silver prices) and lower equity prices due to increase safe-haven buying on the uncertainty.
Gold Price V/S S&P 500 Index
Gold Price V/S MSCI World Index
Gold Price V/S Bitcoin
-
In today’s episode, Dave Russell of GoldCore TV chats with Michael Pento of Pento Portfolio Strategies LLC, who shares his realistic perspective on how the Fed has made a massive policy error and why he believes we are potentially on the verge of an 80% market crash.
To learn why Michael Pento is raising his gold allocation to 15%, watch the full episode.
Click the Video Below to Watch
Make sure you don’t miss a single episode… Subscribe to our YouTube channel
Click Here to Download Your Copy Now
Should You Invest In Gold 2022
Watch Rick Rule Only on GoldCore TV -
Stephen Flood, CEO of GoldCore was welcomed by Jimmy Atkinson and Andy Hagans of The Alternative Investment Podcast where they discuss the compelling reasons why gold should be an integral part of portfolios during these times.
Increases in the threats of cyber warfare, geopolitical tension, and continued inflationary pressures means that investors need to strongly consider how the traditional assets in most portfolios will perform in these challenging timesClick Below to Listen to the Podcast
-
In our post on February 10, 2022 “The Bank of England: There’s Only One Solution!” we wrote about the Bank of England governor’s solution to inflation was for workers to exercise ‘wage restraint’ when negotiating higher wages.
And this week we share the chart below from Bloomberg which sums up in one chart the truth about real wages and the decline of U.K. living standards.
It’s certainly not the workers that benefit from higher inflation!
UK Living Standard Chart
Moreover, to get a handle on inflation the Bank of England Governor, and other central banks need to change their plea from employees to companies.
Are the Companies Taking Advantage of Inflation?
Meanwhile, companies are not only benefiting from higher inflation but boasting about it!
A February 7 headline from Reuters reads “Tyson Foods shares set a record as high meat prices fatten profits”. The article goes on to say that:
“Tyson Foods Inc (TSN.N) shares climbed more than 11% to an all-time high on Monday after the company reported that first-quarter profits nearly doubled due to soaring U.S. meat prices …
The average price for Tyson’s beef surged 31.7% in the quarter ended on Jan. 1, while the unit’s operating margins jumped to 19.1% from 13.2% a year ago.
Average prices for all of Tyson’s products climbed by 19.6% … Tyson said it raised meat prices to offset higher costs for labor, transportation and grains used for animal feed.
Its cost of goods rose by 18% in the quarter, and King told reporters he expects grain prices will continue to rise.
The bottom-line summary is that Tyson’s costs due to higher labor, transportation, and grain costs rose by 18%, but Tyson raised its prices to consumers on average 19.6%, and as high as 31.7%.
In other words, Tyson ‘padded the inflationary increase to increase its margins.
Grocery Stores Taking Advantage of Inflation
Tyson isn’t the only retailer ‘padding’ its cost increases. An article last year from CNN Business headline read
“Grocery stores are excited to charge you higher prices.” This article went on to say:“The rising prices for staples like milk and pork affect grocery stores too, as they have to pay more to their suppliers.
But while they are raising prices under the guise of increasing supplier costs, they’re adding a little extra on top of that …
When grocery stores’ costs rise, stores will “mark up the full rate of inflation plus a little bit more,” said Burt Flickinger, the managing director of retail consultancy Strategic Resource Group.
For example, if the price of meat that a store pays to its suppliers goes up 6 cents a pound, the store might raise the price it charges for that same meat by 10 cents Inflation is the “greatest gift the supermarket sector could get,” said Flickinger. “They have not had these inflation benefits in years.”
The CEO of Kroger, a major U.S. grocery chain, told analysts on an earnings call that “our business operates the best when inflation is about 3% to 4%, A little bit of inflation is always good in our business.”
To add to this the CEO of Albertsons, another U.S. Grocery chain states
“customers will be able to afford higher prices because the economy is growing and consumers have cash to spend.
We’ve never had an environment like this with such a strong consumer where inflation goes higher.
And inflation will have to go really high for it to start mattering where the consumer starts clamping down on purchases.”
For their part, central banks are scrambling to tighten policy to try and stave off higher inflation.
With the probability of almost 60% that the Federal Reserve (the U.S. Central Bank) will raise rates 0.50% instead of only 0.25% (the other 40% probability) at its March 16 meeting.
With some Fed watchers calling for an ‘emergency’ interest rate increase before the next scheduled meeting.
Then for an additional 5-6 increases by 2022 yearend. A very aggressive rise in interest rates in other words.
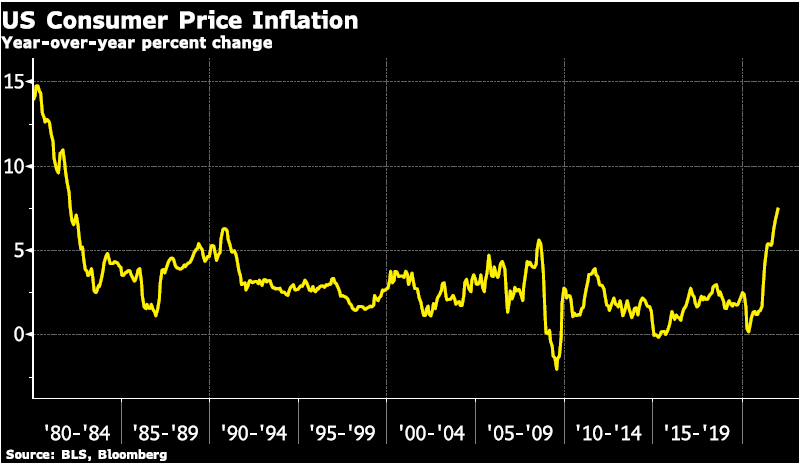
This higher probability of a ‘double increase’ came after U.S. Consumer Price Inflation (CPI) rose 7.5% in January – the highest yearly increase in 30 years.
US Consumer Price Inflation Chart
Contributing to this 7.5% was rising oil and gas prices – which according to the CPI data release rose 40%+, and used cars and truck prices also rose 40%+ plus from the previous year.
New cars, meats, poultry, fish, and eggs all rose 10%+.
Also, most of the price increases can be attributed to oil price increases, computer chip shortages, and food commodity price increases. This brings us back to the ‘padding’ of price increases discussed above.
Additionally, the question is will central banks be able to raise rates as quickly as markets currently expect.
Also, one measure to garner longer-term economic growth expectations is the yield curve, which is longer term government bond yields minus shorter term government bond yields.
The chart below shows the U.S. 10-year bond yield minus the U.S. 2-year bond yield (yellow line) and the U.S. 10-year bond yield minus the U.S. 3-month Treasury yield.
The picture is a bit muddy at the moment with the spread of the 10-year minus 2-year turning down, but the spread of the 10-year minus the 3-month remaining elevated.
This measure is important because if the yield curve becomes inverted, meaning short-term rates are higher than long-term rates, history shows that a recession is soon to follow. Also, no central bank wants a recession, especially the US heading into mid-term elections!
US Yield Curve
What Will Happen to Gold?
We would be amiss to not discuss the surge in the gold price on Friday (February 11) which continued Monday (February 14) of US$57.
Moreover, this surge was on the increased tension on the Russia/Ukraine border with Russia. These tensions eased somewhat on Tuesday and the gold price declined approximately US$30.
Gold Price Chart
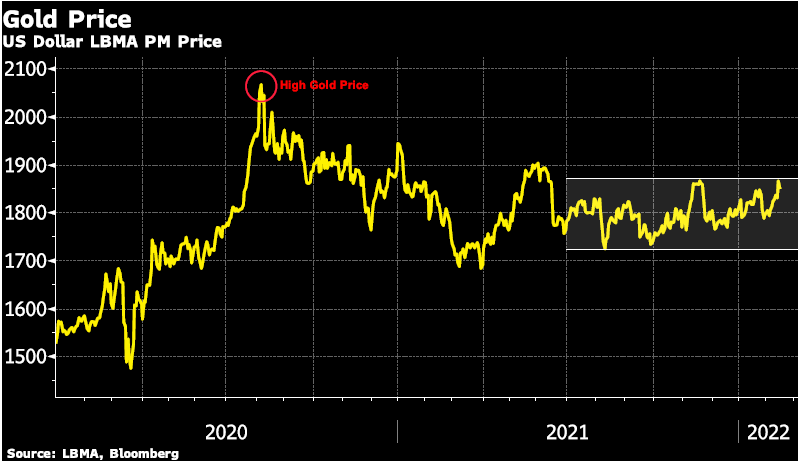
Looking at a longer-term picture of the gold price – the increase in the gold price hit the top of the 9-month trading range for the gold price but failed to breach it higher.
President Biden’s remarks on February 15 were that the United States is “not seeking direct confrontation with Russia” but that the U.S. and NATO are ready to respond decisively to a Russian attack on Ukraine, which remains very much a possibility”.
The two near-term catalysts that could likely push the gold price past the upper bound of the range are – escalated threats of a conflict with Russia and central banks, notably the Federal Reserve, raising interest rates at a slower trajectory than currently expected by the market.
Gold Price: US Dollar LBMA PM Price Chart
-
Central Bankers have lost all sense of reality…
It is no secret that central banks have turned their full attention to the high inflation numbers.
And there is little doubt in most consumers’ minds that prices of everyday goods and services are rising faster than official measures indicate.
The Bank of England is no exception – its monetary policy committee voted 5-4 to raise the bank rate by 0.25% at its February 3 meeting, with the four dissenting members wanting a larger increase of 0.50%.
Also, the official consumer price inflation numbers in the UK show prices rose over 5% from a year ago, and the expectation is the percent increase is going higher in the coming months.
Pressure on The Bank of England is High!
The Bank of England’s statement reads:
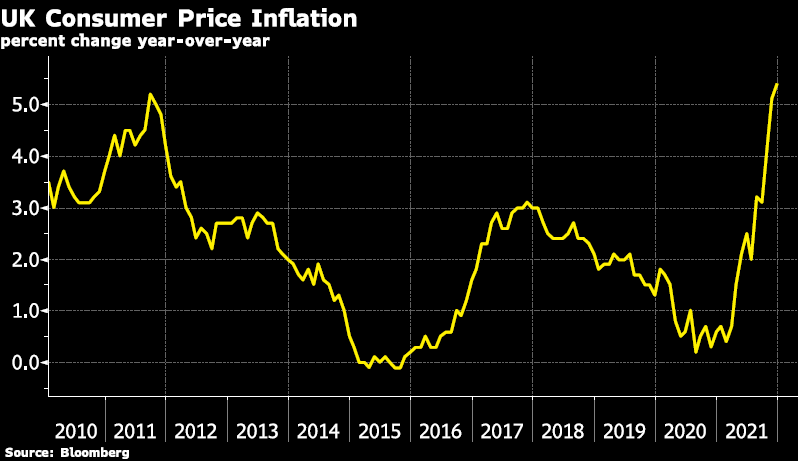
Twelve-month CPI inflation rose from 5.1% in November to 5.4% in December, almost 1 percentage point higher than expected at the time of the November Report.
Inflation is expected to increase further in coming months, to close to 6% in February and March, before peaking at around 7¼% in April.
This projected peak is around 2 percentage points higher than expected in the November Report.
Also, the projected overshoot of inflation relative to the 2% target mainly reflects global energy and tradable goods prices.
The further rise in energy futures prices meant that Ofgem’s utility price caps were expected to be substantially higher at the reset in April 2022.
Core goods CPI inflation is also expected to rise further, due to the impact of global bottlenecks on tradable goods prices.
UK Consumer Price Inflation Chart
Here is the catch – the official statement says rising prices are the result of rising energy prices and global bottlenecks. However, then the Bank of England governor, the very next day, says wage increases must slow down to help the Bank of England ‘keep a grip on inflation.
Moreover, going back to the BoE’s official statement on February 3:
Underlying earnings growth is estimated to have remained above pre-pandemic rates and is expected to strengthen over the coming year, to around 4¾%.
This is consistent with the results of the Bank’s Agents’ annual pay survey, with the tight labour market, and with some temporary upward pressure on wage settlements from higher price inflation.
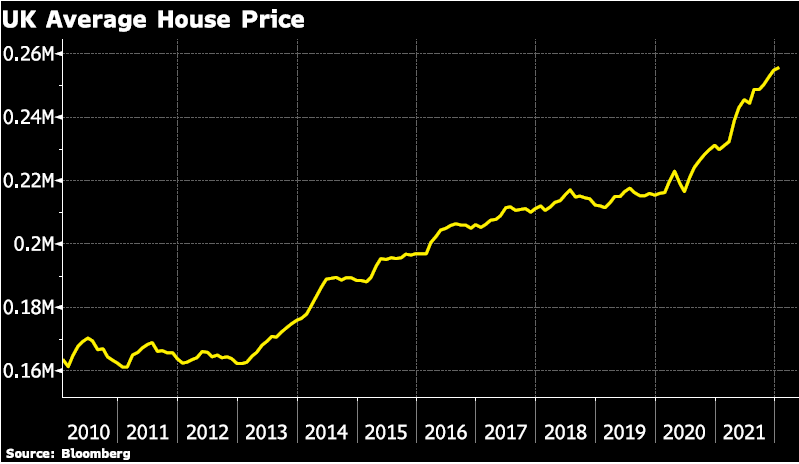
The BoE expects wages to grow at 4.75% meanwhile consumer price inflation is expected to grow at 7.25%.
So wages are not even expected to keep up with consumer price inflation! However, this does not even consider the increase in house prices that are growing at close to 10% per year.
Also, the bank governor does not care that wage earners are by definition losing purchasing power.
UK Average House Price Chart
Wage Restraint to Keep the Grip on Inflation
Moreover, here is the real kicker – BoE Governor Bailey’s salary package (including pension benefits) totaled over £575,000 in 2021.
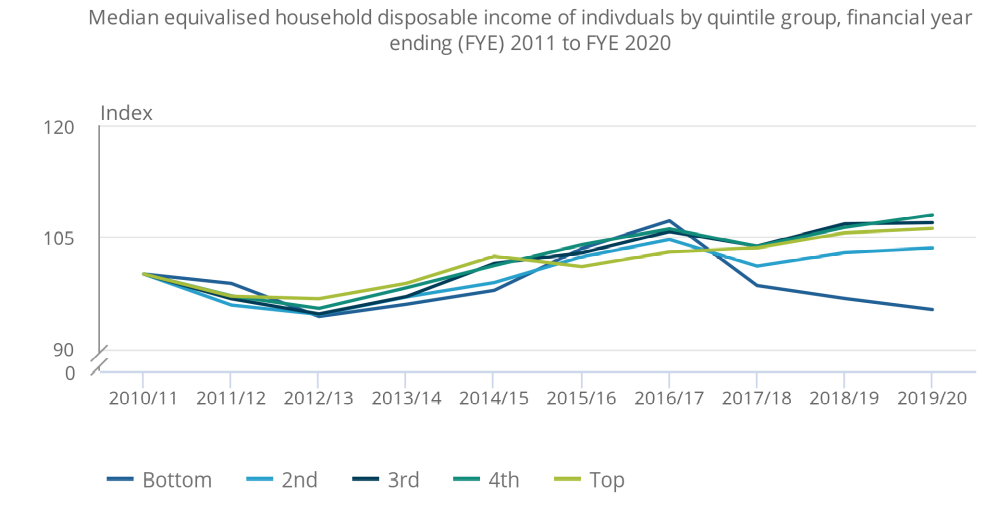
Yet latest figures from the Office for National Statistics for 2020 show UK’s median disposable income (after income taxes) in the UK was just £29,900.
And that this disposable income increased by only 7% during the decade from 2011 to 2020. It is an annual rate of only 0.8% per year.
And even worse this report showed that income for the poorest fifth of the population actually fell by an average of 3.8% per year between 2017 and 2020. This is when inflation is taken into account.
So not only are wages somewhat stagnating for all income levels – but declined for the poorest.
The chart below is from the Office for National Statistics – Household Finances Survey.
National Statistics – Household Finances Survey Chart
Moreover, now that central banks have backed themselves into a corner by keeping the printing presses and financed government largess spending. This is without consulting the citizens; they want the citizens to take the brunt of inflation by not asking for wage increases?
Central banks have helped finance government largess by buying their debt which inflated asset prices including houses, and equity markets through keeping interest rates incredibly low. It was not just since covid but since the financial crisis of 2008-09.
And now that it is time to tighten policy because of inflation partly due to the pandemic they call for restraint from those that can least afford it … the loss of reality is astounding.
- modofantasma and stackerp5
-
 2
2
-
This week on GoldCore TV, Dave Russell welcomes back Gareth Soloway of InTheMoneyStocks.com to talk about what his charts are suggesting for stock markets, bond markets, oil, Bitcoin, gold, silver, and gold miners.
Click the Video Below to Watch
Make sure you don’t miss a single episode… Subscribe to our YouTube channel
- Tn21 and SilverJacks
-
2
-
Will the 2022 Ukraine war push silver higher than the 2022 FED interest rate hikes?
Wars are bad for people. Wars are also bad for the governments and armies that lose.
Winning armies gain glory. But who pays for the wars? Armies have always been expensive to equip and sustain.
Here is the first secret…no one pays for wars. Instead, immense amounts of money get printed or borrowed, and the economies of both combatting countries pay the bill over two successive generations.This is why physical metals prices benefit from war – because their price moves higher to reflect the increasing money supply.
And here is the second secret. Either army could lose a war. Because losing countries don’t get a chance to set the rules after losing a war, winners do, debt and money issued by any combatant country during times of war carries extra risk.
That risk is called counterparty risk. Counterparty risk represents the chance the money you hold was issued by a country or government which might not exist once the war ends.
Physical metals have zero counterparty risk and thus a second reason prices rise during the war.
Effects of War on Silver
Using silver in American dollars as an example here are a selected list of price moves during wartime.
The Korean War from 25 June 1950 until 27 July 1953 saw a silver rise from US$.73 to US$.85 while touching US$.90 along the way.
And it is important to note that silver never ever fell below US$.85 again! So, the Korean war pushed silver up 16% across 3 years.
Vietnam was a long war from 28 February 1961 for the United States until 7 May 1975. Silver was US$.92 when the war started and US$4.40 when the war ended.
Once again, the silver price ran even higher during the war, touching US$6 twice in 1974. The Vietnam war pushed silver up 378% across 14 years.
Should You Invest In Gold 2022
Watch Rick Rule Only on GoldCore TV
Afghanistan was another long war. It really began in 2001 and shared a common history with the Iraq war.Accepted dates are 7 October 2001 until 30 August 2021. War began with silver at US$4.40 with a finish at US$23.77 and peaking at US$49.48 in 2011 at the halfway point. Across 20 years silver moved up 440%.
Using the math above of 16% plus 378% plus 440% we know wartime saw silver move a total of 834%. That 834% spread across 37 total years.Using just the super simple math we should expect that on average silver rallies 22% during war years.
22% on top of today’s silver price takes us from US$22.64 up to US$27.62 should war begin in Ukraine but last a single year.
No one wants war. But this NATO versus Russia problem over the future of Ukraine does not seem to have any other solution.
When USSR fell the UK and USA and Russia all agreed to guarantee the safety and independence of Ukraine.
Download Your Free Guide
The three countries did this in writing with the purpose of convincing Ukraine to part with nuclear weapons it inherited from the collapse of the USSR.
But today Russia has new ideas about the future of Ukraine – namely that Russia wants Ukraine to serve as a buffer space between NATO and Russia. War to impose the buffer by force is increasingly likely.
Higher Silver Prices in 2022?
However, 2022 is a very complex year. Working against higher silver prices are the central banks.
They will spend the year raising interest rates and also shrinking the money supply. Higher rates are theoretically bad for gold and silver.
And silver gets the worst of it when prices fall. Current Fed interest rate forecasts predict at least three rate hikes in 2022 with rates rising from .25% up to 1.15%.
If rising rates in 2022 were the only factor silver prices could decline to US$18.60 per ounce, at least for a little while.
That target price comes from the reference to silver’s US$18.60 level prior to COVID-19 starting in the fall of 2019.
So, will the rising rates defeat the war drums and push silver lower? Well, the US$5 guesstimate of a war premium is greater than the US$4 drop estimate from rising rates.
Therefore, if both things happened the net effect should be a silver price rise.
Silver Price Chart
The chart above is a rare very long-term graph of spot silver back to 1955, using a logarithmic scale. Nobody knows the future.
But we do know that physical metals have no counterparty risk. And on balance, the quick analysis above shows silver should have a good year if both events occur.
-
Dave Russell of GoldCore TV welcomes Rick Rule, the founder, and CEO of Rule Investment Media, to highlight the catastrophic implications for financial markets as the result of Central Bank actions and why he believes that the precious metals market have a significant upside.
Click the Video Below to Watch
Make sure you don’t miss a single episode… Subscribe to our YouTube channel
-
The ‘Fed put’ – gone until there’s blood in the streets
Well, it’s happening. Bitcoin (and other cryptocurrencies are sharply down, along with equity markets in many advanced economies.
And the Federal Reserve (the U.S. Central Bank) statement and press conference on Wednesday didn’t indicate any backing down from raising interest rates, maybe as soon as the March meeting.
The Fed’s stance pivot from ‘the economy needs additional stimulus’ to ‘it is time to start tightening policy’ came at the end of 2021 when Fed officials changed their view that 40-year high readings on consumer price inflation was due to transitory factors and will subside on its own.
Their new stance that high inflation is permanent and is what ensures tighter policy. The Fed has already started reducing how much it is adding to its balance sheet each month with another reduction at Wednesday’s meeting to purchasing a total of US$30 billion in assets in February 2022, from a high of US $120 billion in assets being added to its balance sheet each month.
The Worst Bear Market is Coming
Watch Jim Rogers Only on GoldCore TVThe Fed will likely end these purchases altogether at its next meeting, scheduled for March 15-16.
And is indicating that it will raise interest rates at that meeting too.
The market implied probability currently has a 100% likelihood of a March interest rate hike.
The Federal Reserve is also discussing the possibility of starting to reduce its bloated US$9 trillion balance sheet soon after.
Two points we want to address below – the Fed ‘put’ and the decline in bitcoin.
What is a Fed ‘Put’?
The term was first used in the 1980s when Alan Greenspan was Fed Chair. Investopedia (with our bolding added) defines it as:
Greenspan put was the moniker given to the policies implemented by Alan Greenspan during his tenure as Federal Reserve (Fed) Chair.The Greenspan-led Fed was extremely proactive in halting excessive stock market declines, acting as a form of insurance against losses, similar to a regular put option
… A historical review of the price action after each instance of the Greenspan put lends credence to the market belief that the Fed would continue to back-stop the stock markets in the future.
Since Greenspan, every Fed Chair has exercised their own version of what has now been coined the ‘Fed put’.
Download Your Free Guide
Click Here to Download Your Copy Now
This ‘put’ jargon means the Fed has backed off from tightening policy when equity markets decline significantly.
The Fed (and other central banks) care about equity markets because they are a leading indicator of economic activity. Recessions and recessions lead to layoffs and slack in labour markets associate with sharp declines.
And remember the Fed has a dual mandate of ‘price stability and maximum sustainable employment’.
January 2022’s big change is that the Fed put has been cancelled because central banks think stopping inflation matters more than keeping stock markets near all time highs.
The message that the Fed’s focus is on bringing down the high inflation numbers came through this week’s meeting statement. Also, equity markets continued to decline as did bitcoin.
We are still skeptical that the ‘Fed pivot’ to tighter policy faster is a one-way pivot and that the Fed will not back-track.
The Fed gets scarred if stocks fall another 10%, if so it will not tighten policy as quickly as the markets currently expect.
Remember all that government debt still exists; that the interest payment must be paid on that debt, and higher interest rates mean higher payments.
There is also the housing market to consider, yes it might be bloated but a housing crash is not something the US administration would be pleased about heading into mid-term elections.
So, in our view, the ‘Fed put’ is not over forever because we expect central banks will flinch!
The Bitcoin Collapse
Now let’s talk about the decline in Bitcoin.
Yes, equity markets are down, with the S&P 500 close to 10% of its highs, and the NASDAQ down 15%. However, Bitcoin is down almost 50% off its highs as of the time of writing.
The significance of this is that this is the sixth time since the end of 2017 that Bitcoin has declined more than 40%.
Yes, that’s right, six times in just over four years. And remember a 50% decline takes a 100% gain to put it back at the same place it started.
Over this same period, the largest decline in the S&P 500 was 34% at the start of the Covid crisis. The second largest decline was 20% at the end of 2018.
And gold’s largest decline over this time period was 19% after reaching its all-time high in August 2020.
Bitcoin has been touted as a gold alternative in a portfolio.
However, two reasons this does not hold are that Bitcoin does not act as a portfolio diversifier the same way that gold does.
Silver Price Prediction 2022
Watch David Morgan Only on GoldCore TVMeaning that Bitcoin and equity markets have both moved significantly down. Also, Bitcoin has magnified the decline of the equity markets.
Gold on the other hand has had a small increase since the beginning of the year.
The second issue is the sheer volatility of Bitcoin. Six declines of more than 40% in four years is quite a speculation!
Yes, the gold price has had the peak to trough declines over bear cycle periods. However, over 40% declines have occurred four times in the last 50 years. This is quite the difference in frequency to be sure!
-
Legendary investor and adventure capitalist Jim Rogers joins Dave Russell of GoldCore TV to discuss the next bear market, China’s decline, and his top investments. Watch the full episode to learn more.
Click the Video Below to Watch
Make sure you don’t miss a single episode… Subscribe to our YouTube channel
Silver Price Prediction 2022
Watch ‘Silver Guru’ David Morgan Only on GoldCore TV -
European Energy Crisis: 4 Reasons You MUST Know!
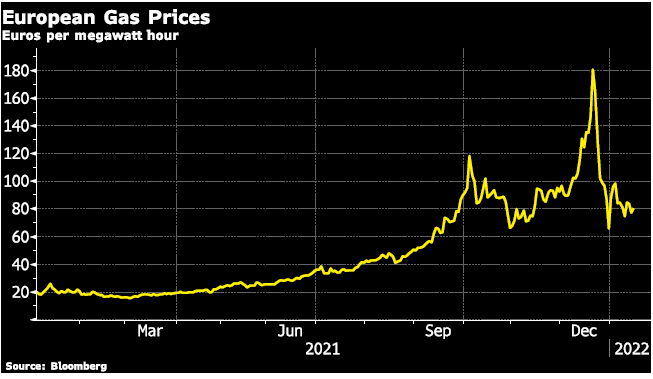
European households are facing rising prices on many goods and services, but one particular standout is electricity and gas bills.
According to Bank of America, European household gas bills are expected to rise to €1,850 in 2022 from €1,200 in 2020 (an ~55% increase).
Natural gas prices have pulled back from the December peak. However, it remained high and it could get worse over the remainder of the winter months.
European Gas Prices Chart
Reasons for the energy crisis are not entirely straightforward as the global energy market is interconnected and quite complex.
However, below we outline some of the key issues:
A. Europe reliant on Gas Imports as Domestic Production
Europe is increasingly reliant on gas imports as domestic production, in countries such as the Netherlands, has declined.
According to the International Energy Agency (IEA), underground storage remains the principal source of short-term flexibility for gas markets in Europe.
This Will Effect Us All
Watch Steve St. Angelo Only on GoldCore TVHowever, lower than average inventory levels (around 50% full as of early January, compared with an average of nearly 70% for this time of the year over the past decade) create further security of supply concerns, especially in the event of late winter cold spells.
This is why uncertainty over prices and supply remains high in early January with most of the heating season still to come.
European Natural Gas Storage Chart
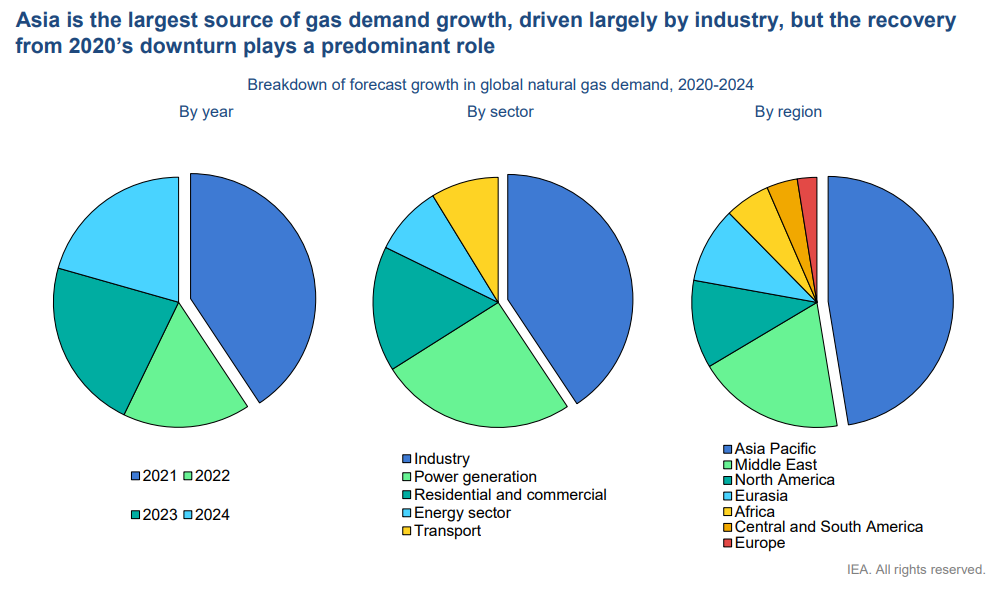
B. Robust Rebound in Demand- Especially in Asia Taking Supply
More than half the increase in demand to 2024 is expected to come from the Asia Pacific Region. Driven by China and India as well as by emerging markets in South and Southeast Asia.
Competition for liquified natural gas (LNG) cargos from Asia have also been a driver in providing less flexibility for supplies in Europe.
Source: IEA
C. Other Energy Sources not Producing Enough
Adding to the energy crunch was less electricity being produced across the European bloc due to lower wind speeds than usual.
The largest producing countries, Britain, Germany, and Denmark harnessed just 14% of total capacity in the third quarter of 2021. This was down from 20-25% in previous years (Source: Refinitiv).
This low production of wind sourced energy was compounded by France’s largest electricity supplier, EDF, taking additional nuclear reactors offline for maintenance issues.
Reuters reported French power giant EDF (EDF.PA) said it had found faults on pipes in a safety system at its Civaux nuclear power station, and it would shut down another plant because it used the same kind of reactors.
D. Russia provides ~40% of Europe’s Natural Gas
Greatly exacerbating lower storage levels and reduced energy from renewable sources, higher natural gas prices could all boil down to geopolitics.
Per a recent report from the EIA, European gas markets have strong elements of ‘artificial tightness’, which appears to be due to the behavior of Russia’s state-controlled gas supplier (Gazprom).
Unlike other pipeline suppliers – such as Algeria, Azerbaijan, and Norway –Russia has reduced its exports to Europe by 25% in the fourth quarter of 2021 compared with the same period in 2020 – and by 22% compared with its 2019 levels.
And this is despite the exceptionally high market prices for natural gas that we have seen in recent months.
The EIA further states, “Against today’s low baseline, we estimate that Russia could increase deliveries to Europe by at least one-third, or over 3 billion cubic meters per month.
This equates to almost 10% of the European Union’s average monthly gas consumption. This would be the equivalent of a new LNG tanker delivering a full cargo of natural gas to Europe every day.
Together with the current high level of LNG inflow, this would provide significant relief to European gas markets”.
And according to Brooking’s report, Russia denies restricting supplies to Europe.
But Putin taunts the EU for bringing supply volatility on itself. If only German regulators approved the Nord Stream 2 pipeline, Russian gas would again flow abundantly to Europe, Putin suggests.Moreover, the worst part is that the Russia-Ukraine crisis could lead to even higher prices.
The growing tensions could keep prices high for an extended period and even lead to higher prices in the coming months.
The US is discussing harsh sanctions against Russia in an effort to deter an invasion of Russian troops into Ukraine.
Moreover, the hope is that the threat of these sanctions will be enough.
The sanctions on the table for discussion include targeting individuals and companies. Also sweeping sanctions such as cutting Russia off of the SWIFT system, which would remove Russia’s financial institutions from the global financial network.
And directly related to the natural gas crisis a proposed target for sanctions is the Nord Stream 2 gas pipeline.
Nord Stream 2 gas pipeline, when operational would double the amount of natural gas moved from Russia to Germany through the Baltic Sea. This is likely to reduce the need for other pipelines, such as the Urengoy–Pomary–Uzhhorod pipeline that runs through Ukraine (CNBC.com).
The US Senate voted down a proposal for automatic sanctions against Nord Stream 2 operators. However, there could still be sanctions imposed by the US and/or Germany.
Conclusion
Low wind speeds, limited on- and off-shore production, and geopolitics have driven European natural gas prices to record levels because energy demands must be met, especially during winter.
In December, European consumers were paying 15 times for natural gas compared to those in the U.S.
Much will also depend on how low temperatures drop in Europe over the coming weeks.


") It’s not helpful to banks (explained below).
It’s not helpful to banks (explained below).


Is The Ruble Backed By Gold Now?
in General Precious Metals
Posted
Over the past couple of weeks, we reviewed the U.S. government confiscation of gold by Executive Order in 1933. (see “Gold Confiscation: Will History Repeat Itself?” and “The Facts of Gold Confiscation: The Saga Continues”).
One of the points was that the difference between 1933 and today is that gold is not money for banks today. This means banks are not on a gold standard.
Some observers have stated that the announcement by Russia’s Central Bank on March 25 to purchase gold at a ‘fixed’ 5,000 rubles per gram is a return to the gold standard or that it creates a gold-backed ruble.
Below we provide context to the announcement.
Also, why the central bank buying gold at a ‘fixed’ price is not the same as a gold standard.
Russia Sets its Fixed Gold Price
The announcement on March 25 that Russia’s central bank would buy gold from domestic producers beginning March 28 at a fixed 5,000 rubles per gram.
This price ‘fix’ was originally announced to run from March 28 through June 30, but this was revised on April 8 to a ‘negotiated price’.
The policy is an attempt to acquire (domestically mined) at potentially below-market prices with rubles the Bank of Russia can simply print.
The central bank’s initial offer announced on March 25 at a fixed price of 5000 rubles per gram was clearly attractive from the Bank’s (and government’s) perspective. Although not from local producers’ perspectives.
The ruble was quite depressed, and 5,000 rubles per gram was significantly below London market gold prices converted to rubles.
However, now that the ruble has recovered to around 80/dollar, the offer was close to what gold would be worth in rubles on global markets.
Russian Ruble
The ruble has risen sharply in recent days on the back of demands that Russian oil and gas exports to the West be paid for in rubles or gold.
This has created false demand for the ruble.
And Russian energy exporters must turn any euro or dollar receipts directly over to the government in any event.
Additionally, the sanctions have made it challenging for Russia’s domestic producers to sell their gold through the usual channels.
Also, the ruble market is heavily controlled and very illiquid.
Inflation Protection Strategies You Need to Implement Now
Watch Tim Price Only on GoldCore TV
It is clear why the Russian central bank would want to buy gold from its producers.
This is because gold is the world’s oldest form of international liquidity.
Also, if the central bank can get it at a discount all the better.
Moreover, remember that the central bank can print the rubles it pays domestic gold producers.
Printing currency is relatively costless, and a common practice during the war!
The question then is why would Russian miners sell their gold at below-market prices to the Bank of Russia?
And how useful would these rubles be to domestic producers in need of foreign material and expertise?
The first answer is that the sanctions have essentially barred Russia’s gold producers from selling their gold in Western markets.
Further, the only available markets for domestic gold producers are local banks and the Russian central bank.
In essence, domestic gold miners now face a monopsony – one buyer for their output; they are captive sellers.
Ruble Backed By Gold: Is It Just A Gamble?
All of this means that it should be no great surprise that foreign miners in Russia want out: i.e., Kinross Gold to sell all Russian assets in a $680M deal (BNN Bloomberg, 04/05).
Furthermore, there is strong private demand for gold in Russia, and local banks have been selling gold.
Many locals were glad to rid themselves of rubles in exchange for gold or other hard currency, especially at the start of the war as per in reports.
But this is regulated since gold is too important an asset for the government at this time to be sold to those who want to cash in their rubles.
Russia’s central bank had been buying gold for reserve purposes until oil prices tumbled down sharply in early 2020.
This happened when it announced that it would put its gold buying on hold.
For more on this see our December 9, 2021, post- Russia: A Prominent Player in the Global Gold Market.
Download Your Free Guide
Russia’s central bank setting a ruble price for purchases from producers is not the same as a gold standard.
This is also not equivalent to a gold-backed ruble as some observers have suggested with headlines such as:
“It’s Official! Russian Central Bank Announces That the Ruble is Tied to Gold! 5,000 Rubles per Gram” and “A Note on the New Russian “Gold Standard”.
A gold standard ruble would require the government to maintain a fixed ruble price for gold in an unregulated market.
This is entirely different from and has entirely different implications than, an offer to purchase domestically mined gold from captive local gold miners at 5,000 rubles per gram.
Additionally, a gold standard ruble would require the Bank of Russia to buy (or sell) gold for (or from) its gold reserves at a fixed price, on-demand.
The offer to buy gold is one thing but selling gold at a fixed price is something else entirely.
This would mean that anyone that holds rubles could exchange those rubles for gold at the 5,000 rubles per gram price.
Europe Energy Dependence Crisis
Watch Steve St. Angelo Only on GoldCore TV
Meaning Russia’s gold reserves would dwindle rapidly as Russians (and foreign holders, holding unwanted rubles, want to exchange all their rubles for gold.
Then the Bank of Russia will then immediately have to close its gold window.
To declare that one gram of gold is worth 5,000 rubles is easy.
However, to make it good through the active buying and selling of gold in an unregulated market is something the Bank of Russia simply cannot do.
In short, the Bank of Russia is seizing the opportunity provided by this war, and the related sanctions limiting the exports of gold from its domestic producers.
It is purchasing gold from the captive gold mining industry at favorable ruble prices – with essentially costless ruble outlays the central bank prints.